UniTabBank: A Large Scale Multi-Lingual, Multi-Layout, Multi-Type, Multi-Format Dataset for Table Detection

CVIT, IIIT Hyderabad, India

Abstract

Tables play a key role in conveying structured data across documents. Accurate table detection is crucial for downstream tasks like structure recognition and information extraction. However, current datasets lack diversity in format, language, and layout, limiting real-world generalization. This underscores the need for well-annotated datasets that are multi-lingual, layout-diverse, document-agnostic, and format-rich.

To address these limitations, we introduce UniTabBank, a large scale, diverse table detection dataset designed to reflect realistic use cases. UniTabBank is characterized by five key attributes: (i) Multi-Lingual — supporting 28 languages (including Arabic, English, Hindi, etc.); (ii) Multi-Layout — encompassing both single-column and multi-column documents; (iii) Multi-Type — covering a wide range of document genres such as annual reports, books, newspapers, and magazines; (iv) Multi-Format — comprising scanned documents, photographed pages, and PDFs; and finally (v) Scale and Annotation Quality — consists of 55,443 document page images with 81,179 accurately annotated table instances, offering scale and annotation precision.

Additionally, we introduce UniTabDet, a YOLO-based model for table detection, which outperforms state-of-the-arts on eight out of nine table detection benchmarks. Cross-benchmark evaluation highlights the strong generalization capability of UniTabBank compared to existing benchmarks.

UniTabBank Dataset

The UniTabBank dataset comprises a total of 55,443 document images, organized into four primary categories based on content and layout: Annual Report (55%), Book (21%), Magazine (17%), and Newspapers (5.3%). These document images are available in three formats: PDFs, photographed documents, and scanned documents. The dataset spans 28 languages, including Arabic, Assamese, Bengali, Bodo, Chinese, English, Farsi, French, Gujarati, Hindi, Indonesian, Japanese, Kannada, Korean, Malayalam, Manipuri, Marathi, Nepali, Oriya, Punjabi, Sanskrit, Sinhala, Spanish, Tamil, Telugu, Thai, Urdu, and Vietnamese. In total, the dataset contains 81,179 annotated table instances. Tables exhibit a wide variety of table layout structures, including (i) bordered tables with complete row and column separators, (ii) bordered tables without row and column separators, (iii) borderless tables with row and column separators, (iv) bordered tables with partial separators, (v) tables containing merged cells, and (vi) tables without merged cells.

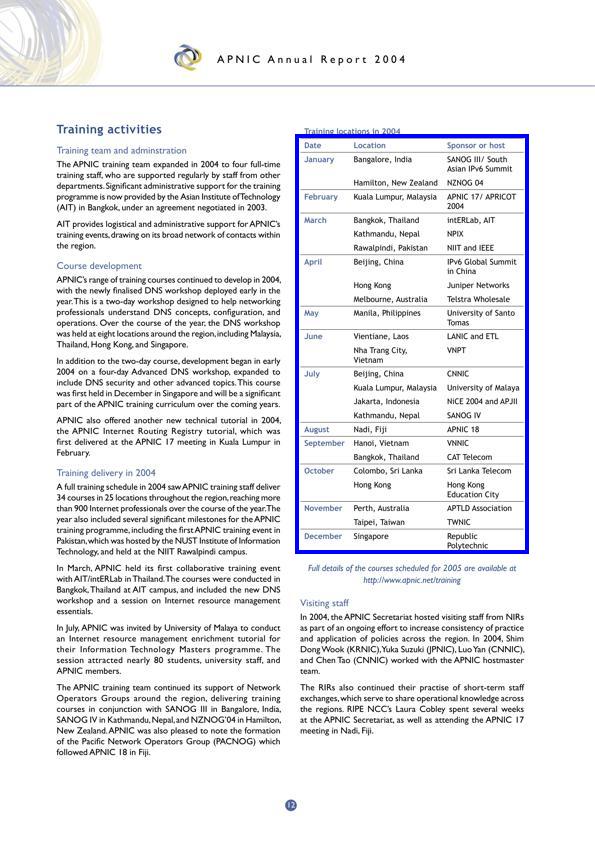
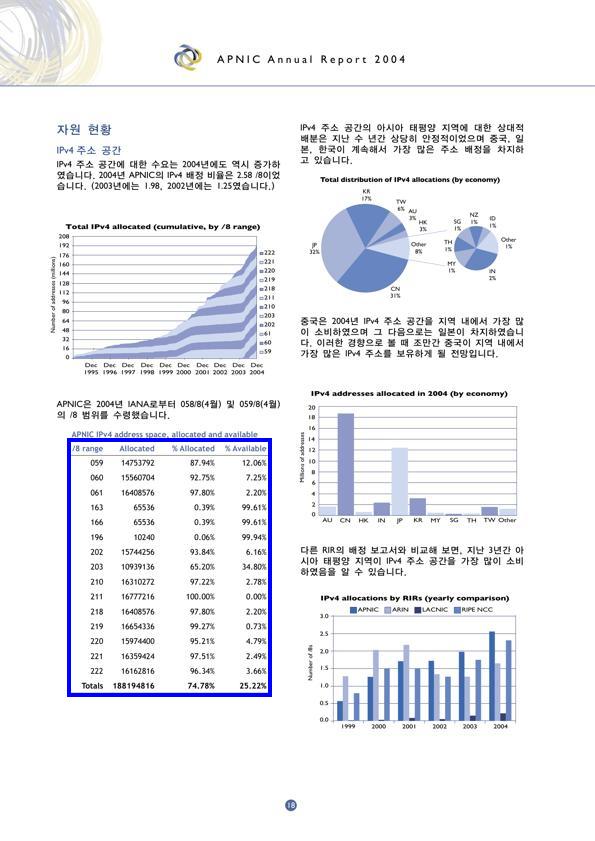
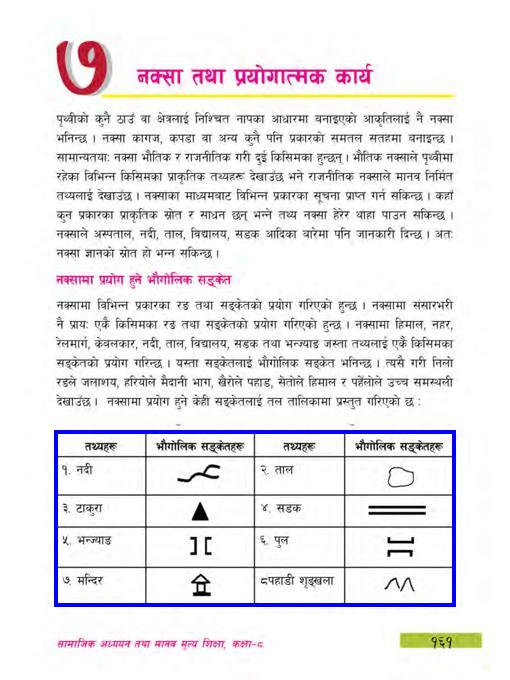
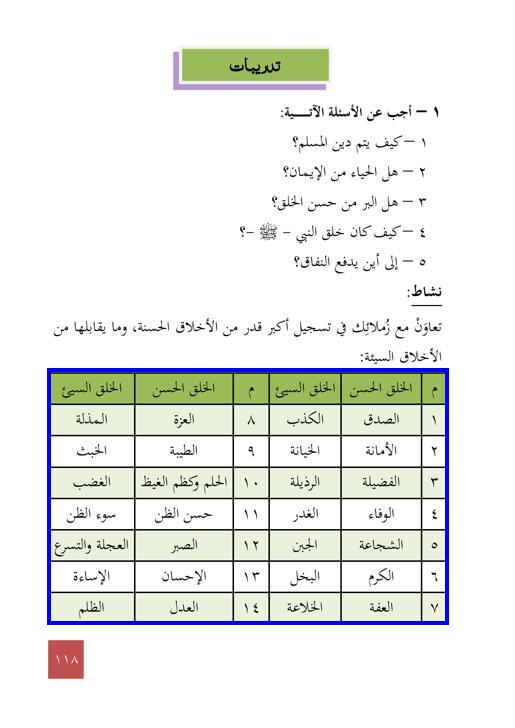
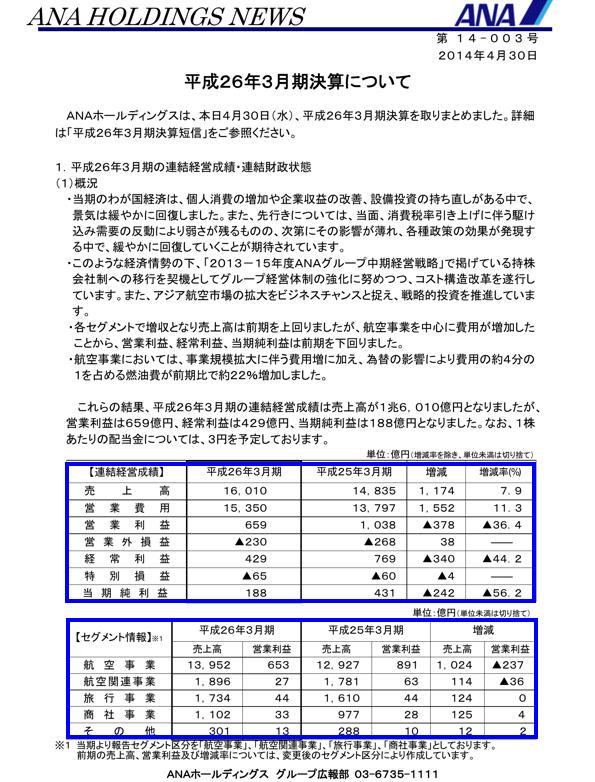
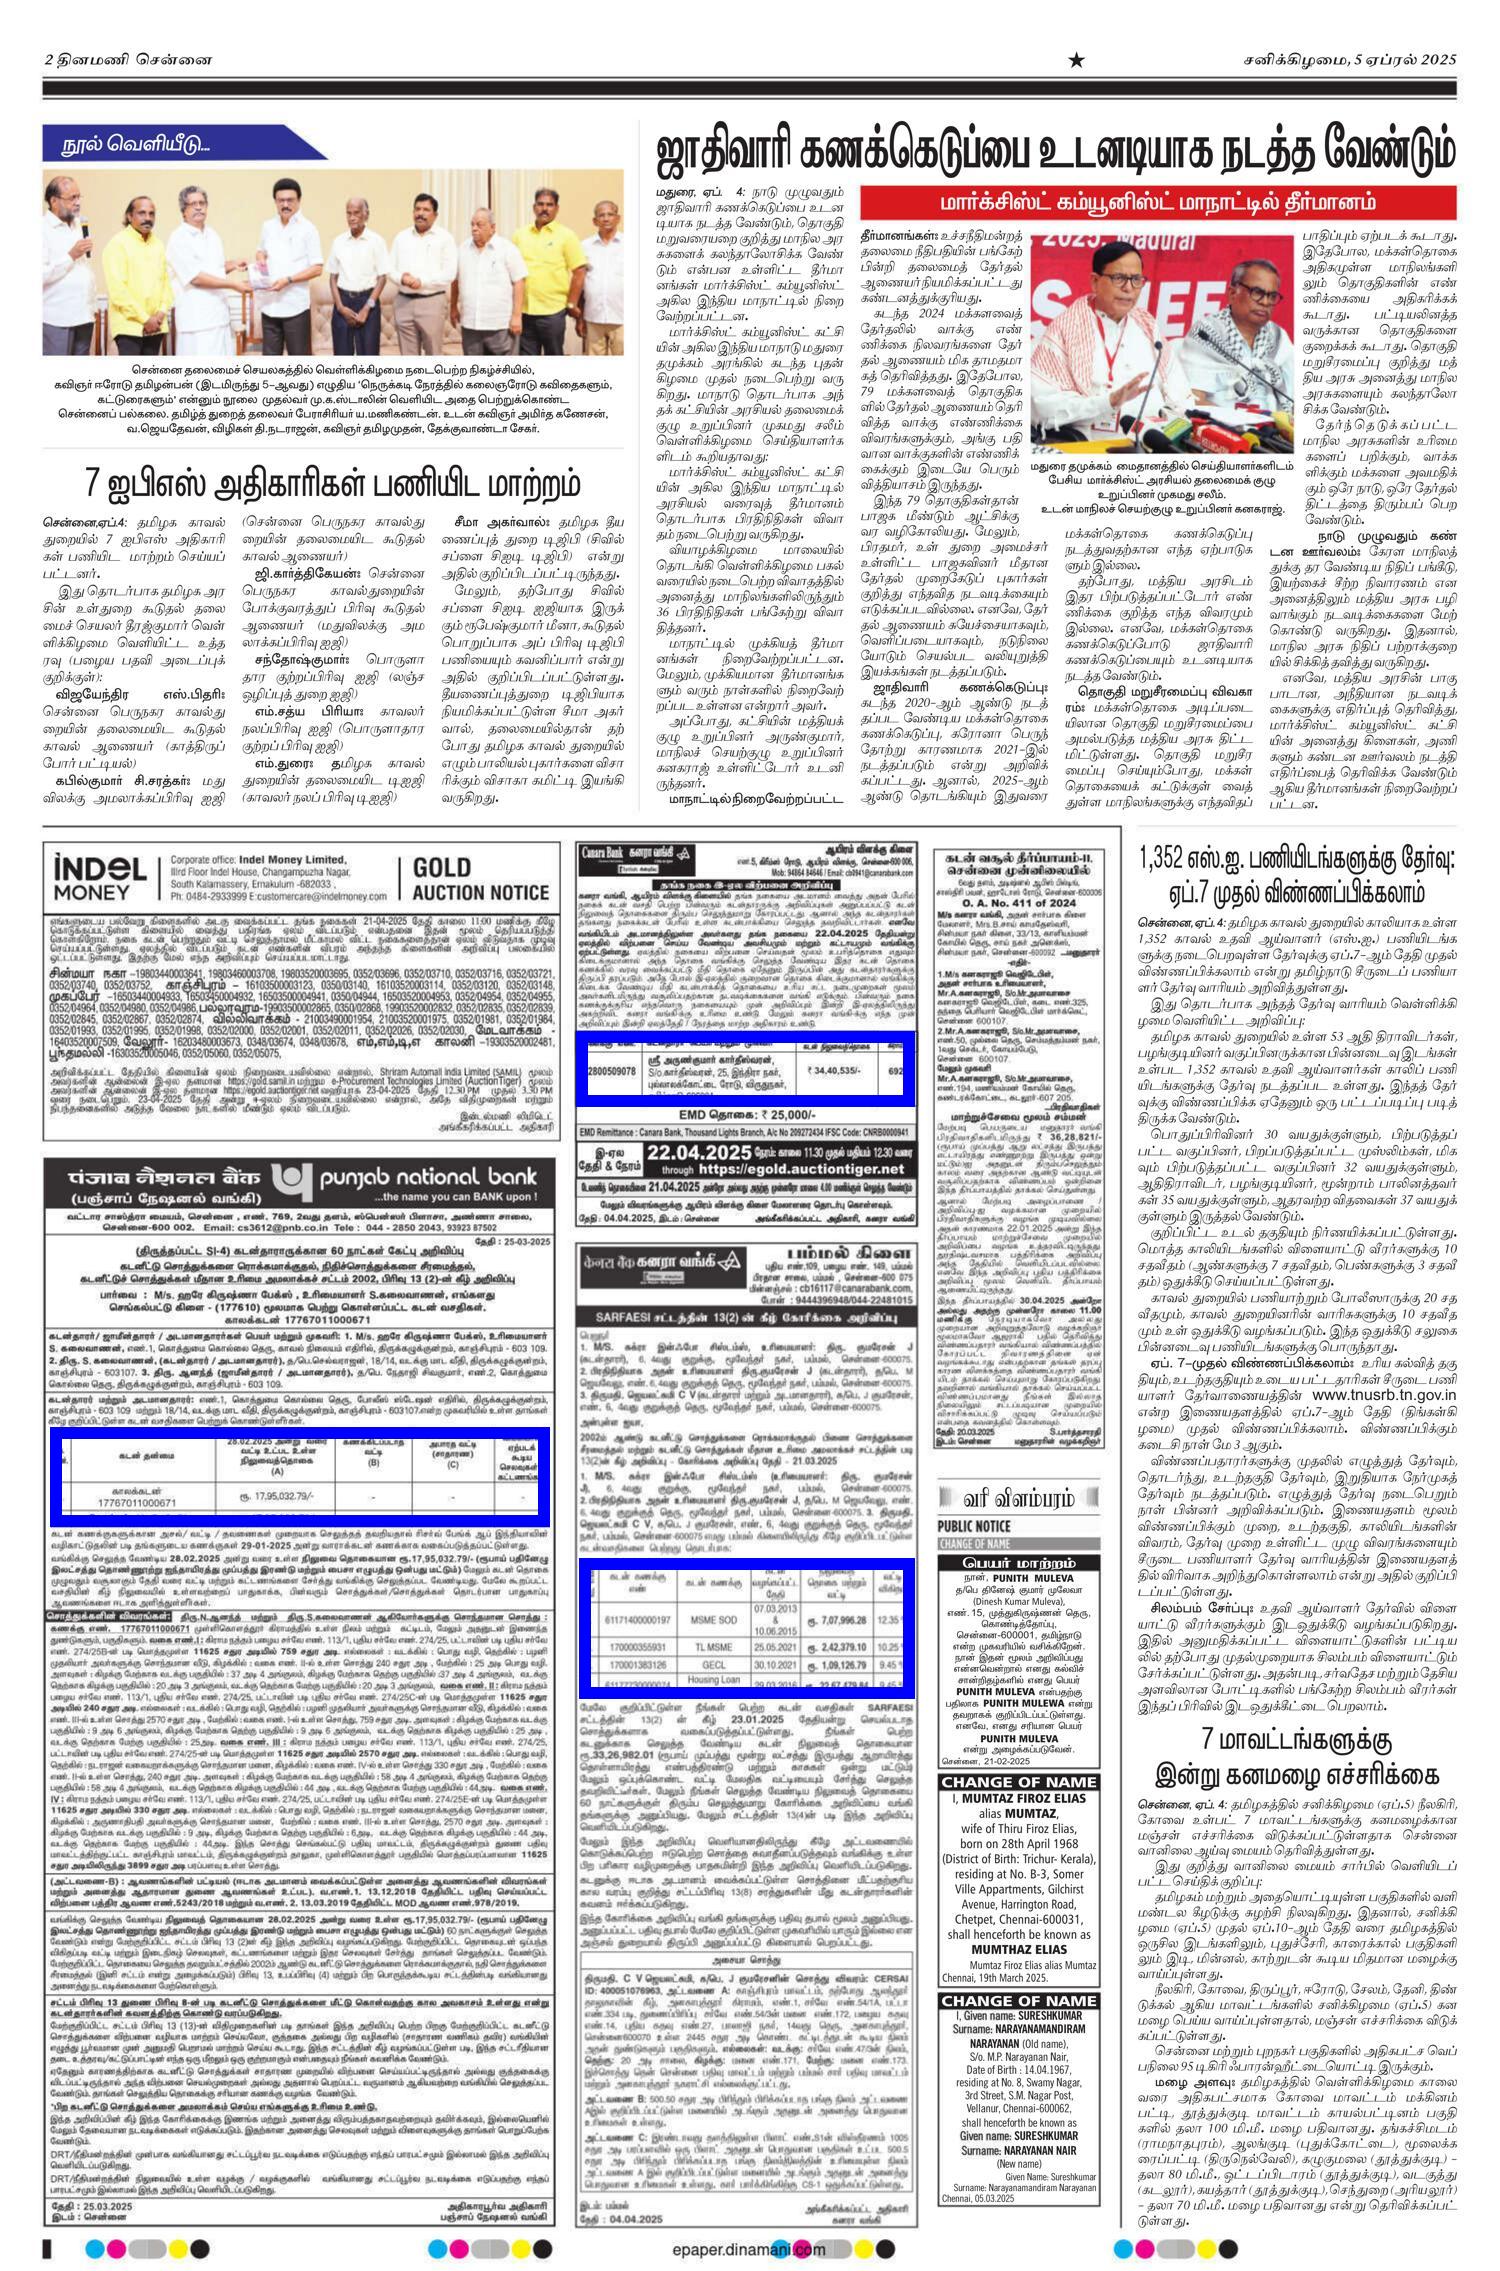
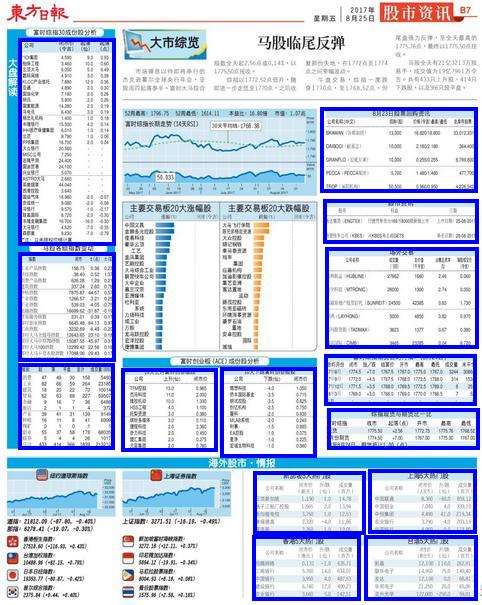
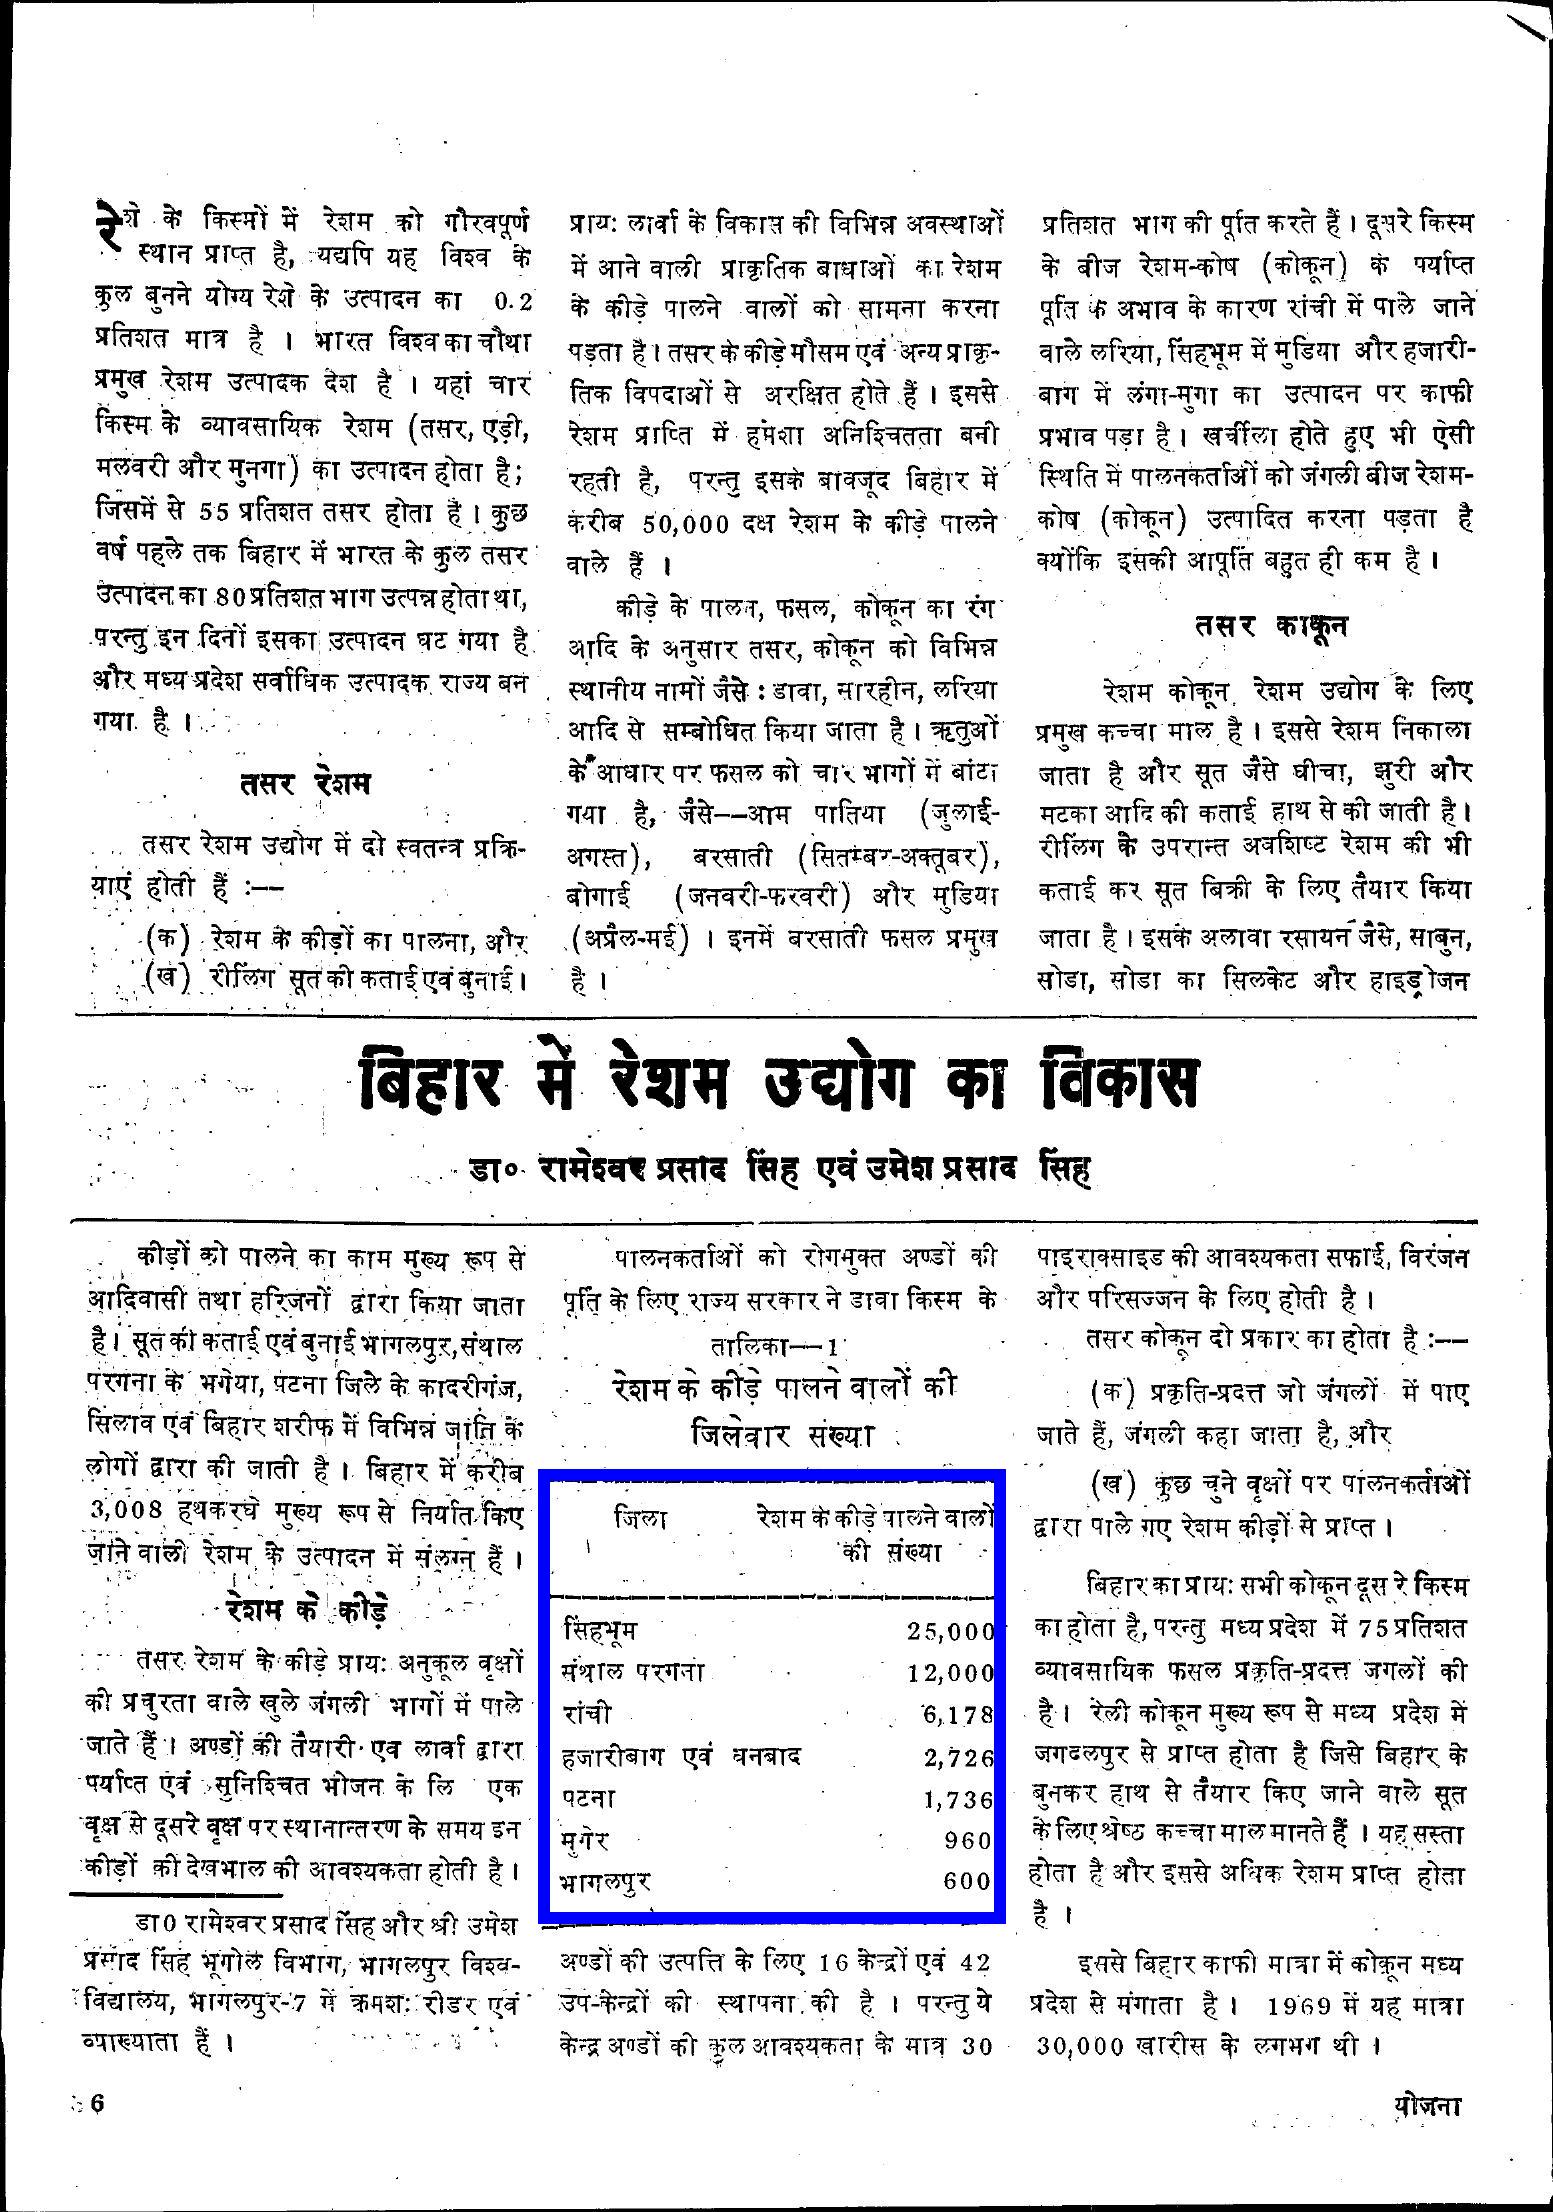
Examples of complex document pages with annotated table bounding boxes with blue colored rectangles across different document formats, types, layouts, and languages.

Dataset #Image #Instance A.M Format Document Type Language
ICDAR-2013 238 150 Manual PDF, Scanned Government documents English
ICDAR-2019 1,639 3,600 Manual PDF, Scanned Books, Scientific journals, Forms, Financial statements English
UNLV 2,889 558 Manual Scanned Technical reports, Magazines,Business letters, Newspapers English
DeepFigures 5.5M 1.4M Automatic PDF Research articles English
Marmot 2000 958 Semi-automatic PDF Books and Research articles English, Chinese
TNCR 6,621 9,428 Semi automatic PDF, Scanned - English
STDW 7,000 12,431 Manual PDF Invoices, Research papers, Books English, German,Japanese, Hindi, etc.
ICT-TD 5000 - Manual PDF ICT commodities English
TableBank - 417,234 Automatic Word and LaTeX documents - English, Chinese,Japanese, Arabic
PubTables-1M 1M 948K Automatic PDF Scientific articles English
UniTabBank (ours) 55,443 81,179 Semi automatic PDF, Scanned, Photographed Annual reports, Books, Magazines, Newspapers 28 languages — English, Arabic, Urdu, Hindi, etc.

Shows table detection benchmark datasets along with UniTabBank. A.M. denotes the annotation mechanism.

Generalization Capability of UniTabBank

Training Set Test Set AP50 AP75 AP
PubTables 0.994 0.994 0.989
TableBank 0.863 0.734 0.665
UniTabBank PubTables 0.993 0.947 0.826
ICT-TD 0.981 0.933 0.828
TNCR 0.985 0.916 0.810
ICDAR-2019 0.985 0.924 0.821
PubTables 0.840 0.719 0.606
TableBank 0.980 0.973 0.958
UniTabBank TableBank 0.933 0.921 0.899
ICT-TD 0.921 0.898 0.865
TNCR 0.916 0.895 0.871
ICDAR-2019 0.916 0.893 0.859
PubTables 0.601 0.528 0.441
TableBank 0.762 0.717 0.684
UniTabBank UniTabBank 0.990 0.986 0.972
ICT-TD 0.890 0.852 0.819
TNCR 0.869 0.823 0.797
ICDAR-2019 0.893 0.853 0.818
PubTables 0.604 0.498 0.417
TableBank 0.391 0.314 0.288
UniTabBank UNLV 0.914 0.854 0.773
ICT-TD 0.663 0.568 0.500
TNCR 0.806 0.723 0.635
ICDAR-2019 0.729 0.653 0.568
PubTables 0.699 0.594 0.519
TableBank 0.675 0.642 0.632
UniTabBank STDW 0.964 0.949 0.928
ICT-TD 0.926 0.895 0.875
TNCR 0.888 0.853 0.830
ICDAR-2019 0.929 0.897 0.879

Cross-benchmark evaluation of UniTabDet trained on different datasets and tested across multiple benchmarks. Models trained on benchmark-specific datasets achieve high in-domain accuracy but generalize poorly, whereas the models trained with UniTabBank achieve consistently strong cross-domain performance. Bold and underlined values represent the best and second best results, respectively.

Comparison with SOTA on Table Detection Benchmarks

TableBank

Method Train Test: TableBank
Dataset #Image P R F1
Li et al. TableBank 260,582 0.966 0.899 0.931
CTabNet TableBank 260,582 0.929 0.957 0.943
CDeC-Net TableBank 260,582 0.934 0.924 0.929
UniTabDet UniTabBank 55,443 0.909 0.965 0.936
UniTabDet TableBank 20,000 0.949 0.979 0.964

Table: Performance evaluation on TableBank using precision (P), recall (R), and F1 score at IoU = 0.5. Model fine-tuned on 20K samples from TableBank. Bold = best, Underline = second-best.

Pubtables-1M

Model Train Test: PubTables
Dataset #Image AP50 AP75 AP
Table-Transformer PubTables 460,589 0.995 0.989 0.970
TabSniper BankTabNet 9,724 0.939 0.906 0.852
ClusterTabNet PubTables 460,589 0.990 - 0.989
UniTabDet UniTabBank 55,443 0.993 0.947 0.826
UniTabDet PubTables 20,000 0.995 0.995 0.994

Table: Performance evaluation on PubTables-1M using object detection metrics. Model fine-tuned on PubTables-1M. Bold = best, Underline = second-best.

Ablation Study

Choice of Architecture

Model AP50 AP75 AP
DocLayOut 0.983 0.981 0.967
TATR 0.919 0.813 0.749
SparseTableDet 0.927 0.8992 0.874
Mask R-CNN 0.901 0.785 0.698
UniTabDet 0.990 0.986 0.972

Table: Comparison of UniTabDet with DocLayOut, TATR, SparseTableDet, and Mask R-CNN on UniTabBank. Bold = best, Underline = second-best.

Model Parameters

Model #Parameters (M) AP50 AP75 AP
UniTabDet (n) 2.6 0.9895 0.9848 0.9672
UniTabDet (s) 9.4 0.9894 0.9852 0.9676
UniTabDet (m) 20.1 0.9895 0.9852 0.9704
UniTabDet (l) 25.3 0.9897 0.9854 0.9709
UniTabDet (x) 56.9 0.9902 0.9857 0.9719

Table: Performance comparison on UniTabBank using UniTabDet model variants (n/s/m/l/x = tiny → extra-large).

Importance of Language

Model Blur AP50 AP75 AP
UniTabDetα Gaussian 0.9890 0.9834 0.9620
UniTabDetβ Median 0.9837 0.9718 0.9442
UniTabDetγ Average 0.9800 0.9684 0.9371
UniTabDet - 0.9902 0.9857 0.9719

Table: Performance comparison between the original UniTabDet and blurred variants on UniTabBank.

BibTeX

@inproceedings{mondal2026unitabbank,
  author    = {Ajoy Mondal, Saumya Mundra, Avijit Dasgupta, C. V. Jawahar},
  title     = {UniTabBank: A Large Scale Multi-Lingual, Multi-Layout, Multi-Type, Multi-Format Dataset for Table Detection},
  booktitle   = {WACV},
  year      = {2026},
}